Performance analyzer
Why is my model slow, and why does it chatter? Tick Profile next to Simulate, or
pass --profile to daedalus simulate, and DAEdalus records where the solver spent its
steps and its time, like Dymola's Simulation Analysis or Amesim's Performance Analyzer.
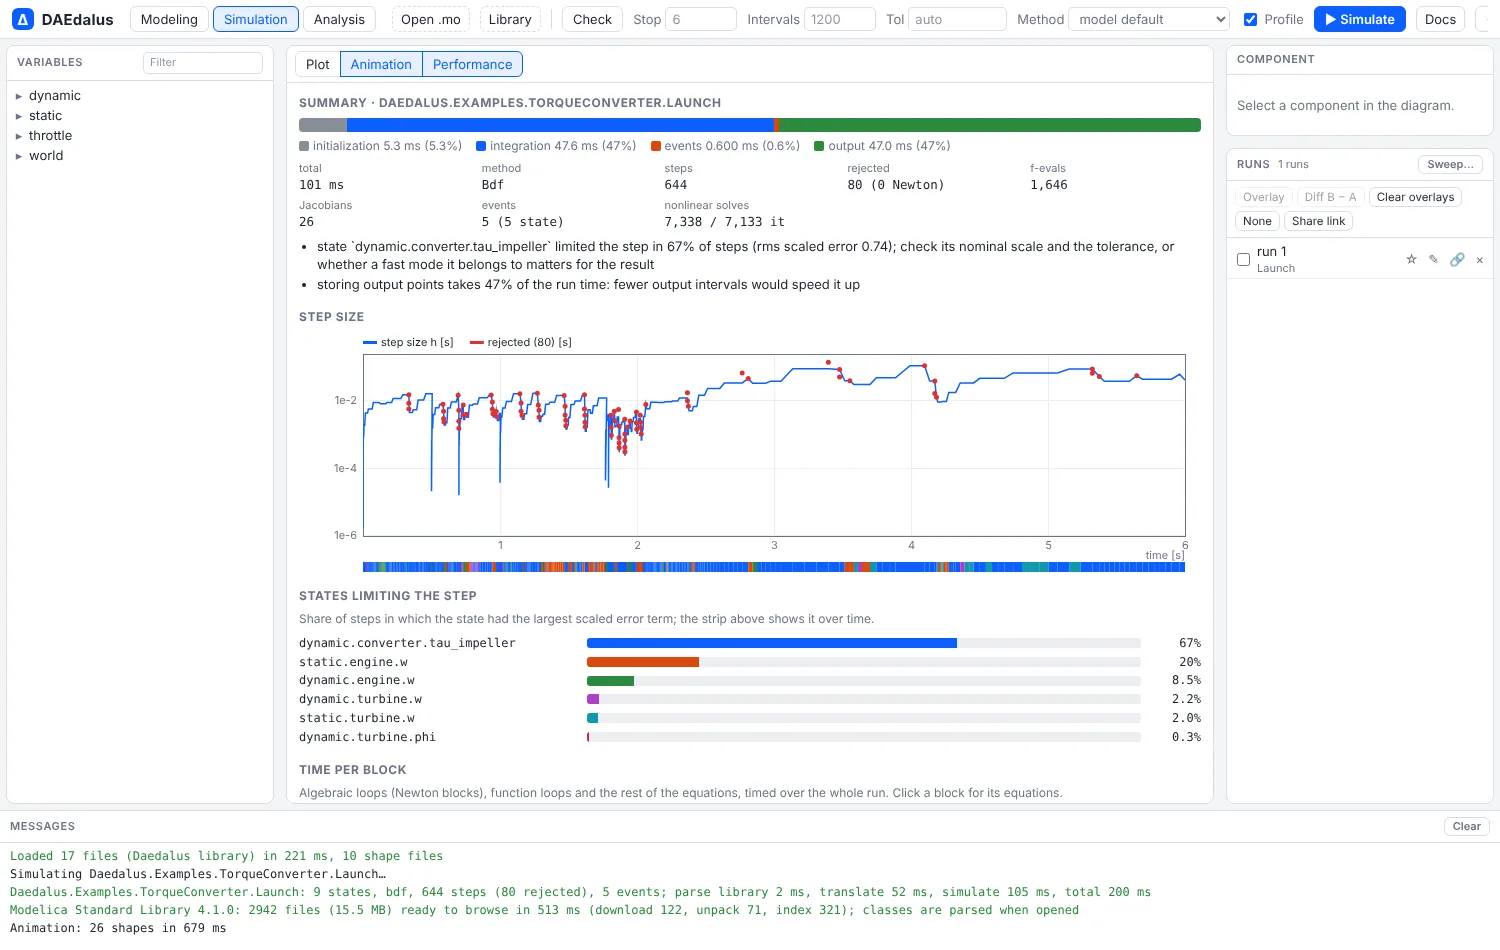
What a profile records
- Step size over time on a log scale, with rejected steps in red, and a strip that colours each step by the state that limited it.
- States limiting the step: the state with the largest scaled error term in each step, as a share of all steps.
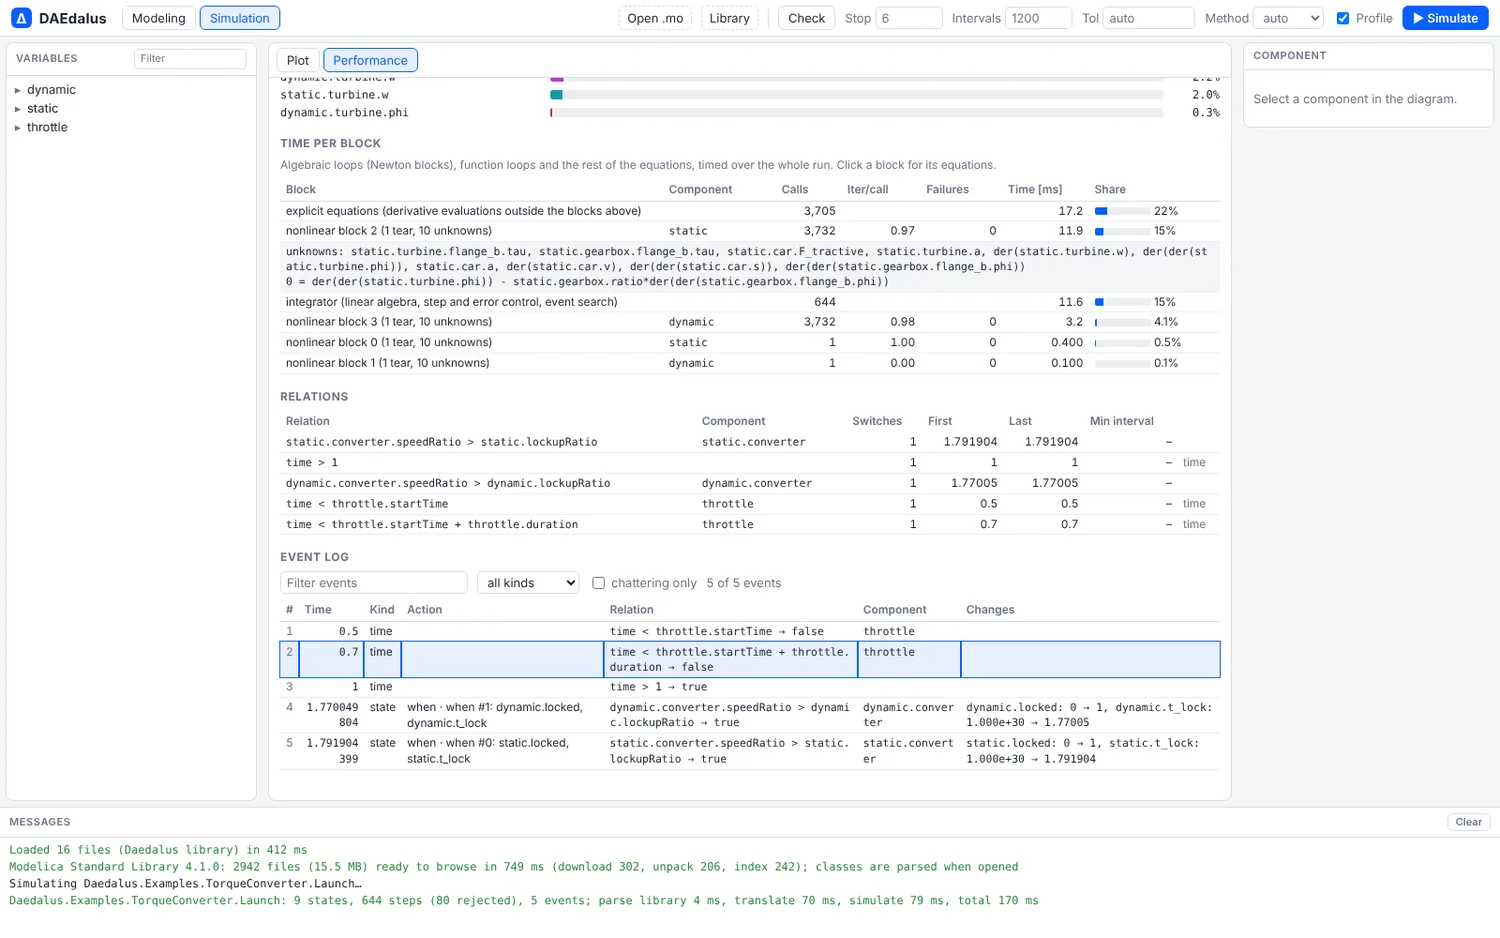
- Time per block: the calls, iterations, failures and time of each algebraic loop and of the explicit equations and the integrator. Click a block for its equations.
- Relations: how often each relation switched, when first and last, and the shortest interval. A relation that switches 20 times in a row, each within 0.05 % of the simulated interval of the last, is flagged as chattering.
- Event log: each event's time, whether a state or a time event triggered it, the
relations that switched (with their source text and component), the
whenclauses that fired and the values that changed. Clicking an event marks its time in the plot. - Hints in plain language, and the time split between initialization, integration, events and output.
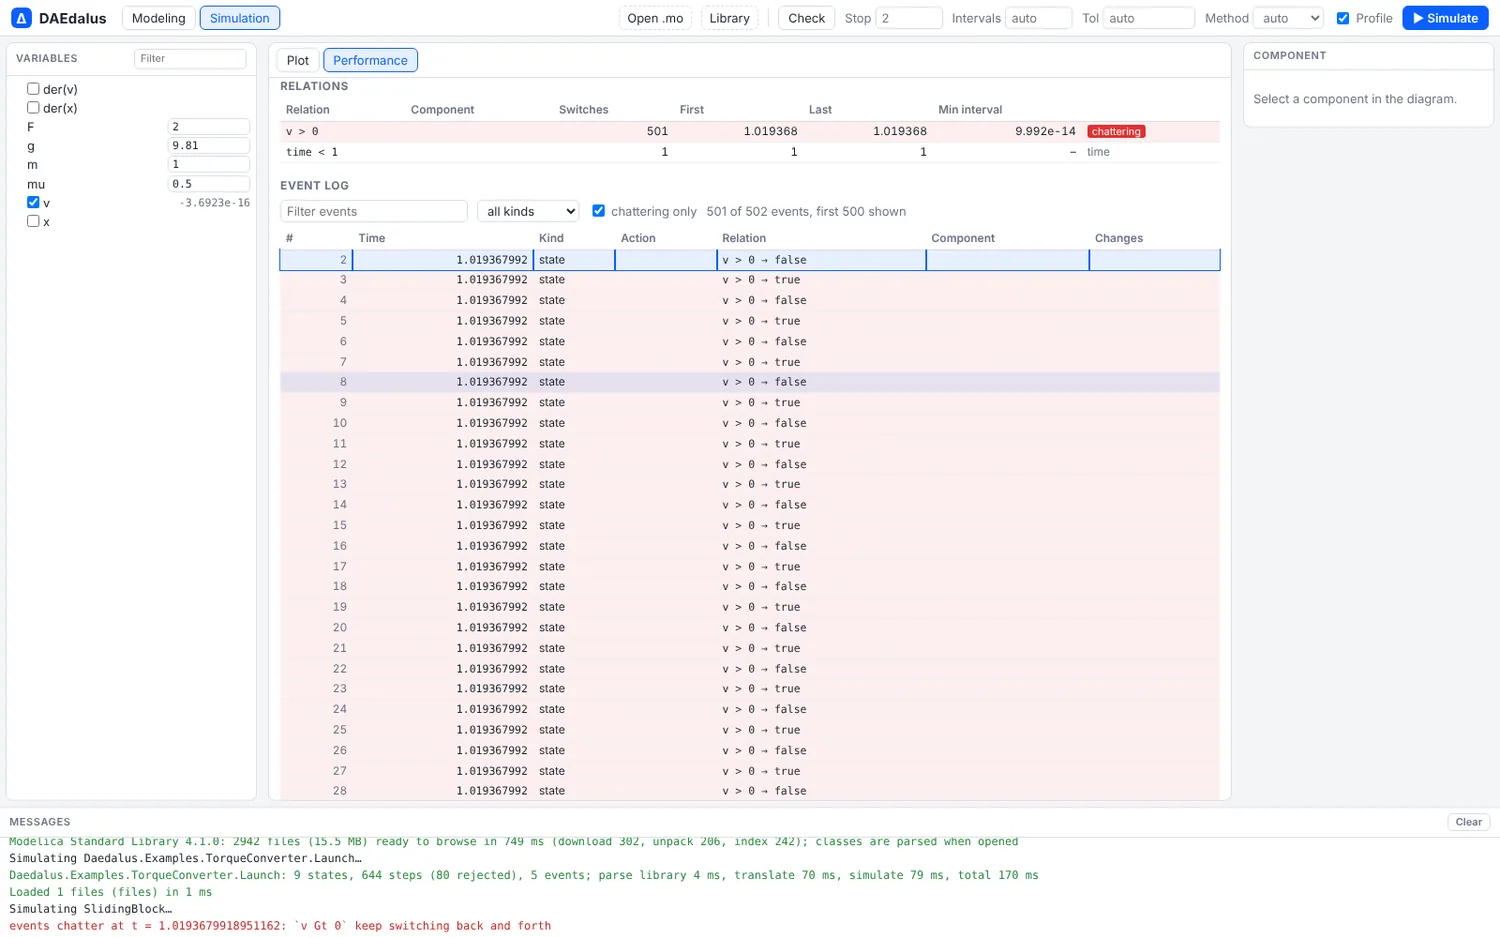
v > 0 switched 501 times within 50 picoseconds and is flagged as chattering.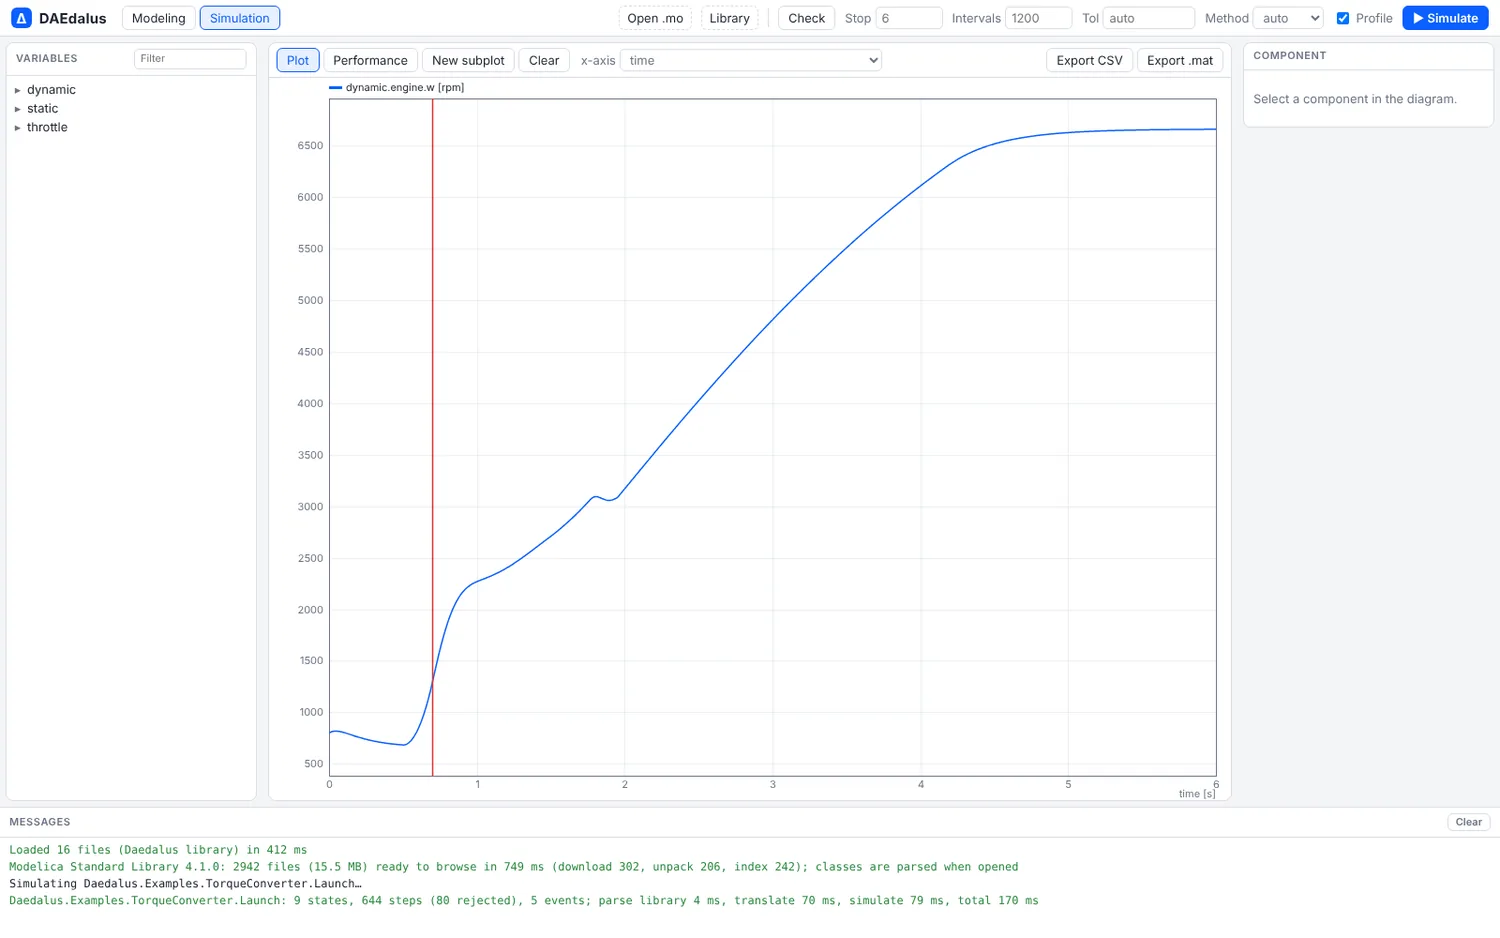
On the command line
daedalus simulate library/Daedalus -m Daedalus.Examples.TorqueConverter.Launch \
    --profile launch-profile.json   # summary on stdout, the full profile as JSON
daedalus simulate model.mo -m M --events   # the event log
Performance profile of Daedalus.Examples.TorqueConverter.Launch (Bdf)
steps: 644 accepted, 80 rejected (0 Newton); 1,646 f-evals, 26 Jacobians, 241 LU; 5 events (5 state events); 7,338 nonlinear solves, 7,134 iterations
step size: 1.659e-6 .. 1.063e-1
states limiting the step (largest error term):
67% dynamic.converter.tau_impeller 430 steps, rms scaled error 0.739
20% static.engine.w 130 steps, rms scaled error 0.422
9% dynamic.engine.w 55 steps, rms scaled error 0.351
relations: 5 switched, 0 chattering
1x static.converter.speedRatio > static.lockupRatio (static.converter) t = 1.79190439891876 .. 1.79190439891876
1x time > 1 t = 1.0000000000001 .. 1.0000000000001
...
hints:
- state `dynamic.converter.tau_impeller` limited the step in 67% of steps (rms scaled error 0.74); check its nominal scale and the tolerance, or whether a fast mode it belongs to matters for the result
- storing output points takes 71% of the run time: fewer output intervals would speed it upThe impeller torque build-up of the dynamic converter model is the fast mode here: it sets the step size for two thirds of the run.
Cost
Profiling is off by default, and then nothing is recorded. Results with and without it are bit-identical. With it on, a run is about 10 to 35 % slower (TorqueConverter.Launch: 4.5 ms to 6.5 ms; the 1,000-mass chain: 344 ms to 453 ms).
To see where the time goes before the solver starts, the structure view shows the algebraic loops and the stiffness; to try another integrator, see Solvers.